Stop guessing what works.
Start proving it.
.jpg)
.png)
.png)
.png)
.png)
.png)
.png)
.png)
.png)
.png)
.png)
Intelligence that drives revenue
30,000+
5,000
24hr
100%
Ready to stop guessing?
.jpg)
.jpg)
Proof, meet pudding
Market benchmarks
Trend analysis
Response intelligence
Always-on visibility
Stop guessing what works.
Start proving it.
Frequently asked questions
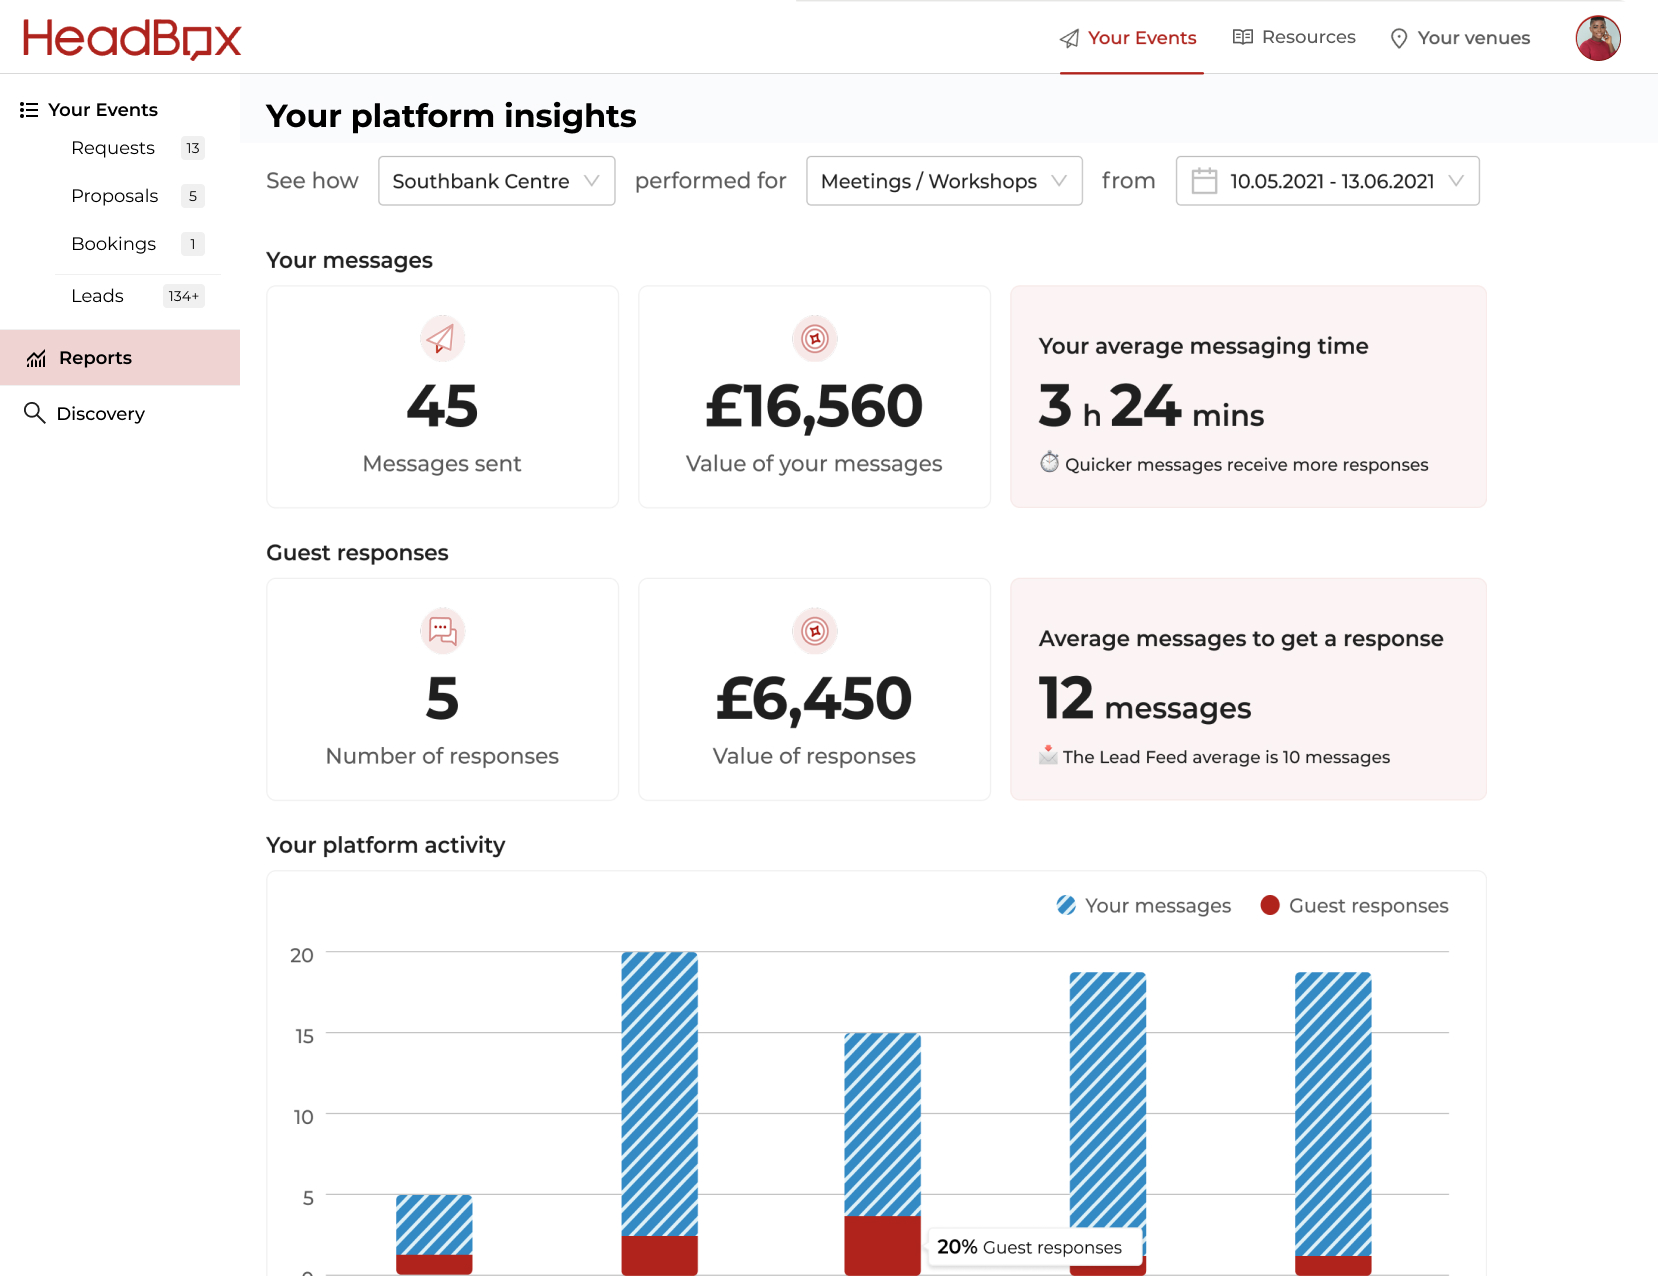
Analytics Suite provides real-time industry insights from 15,000+ enquiries and 5,000+ bookings annually. You'll see average event values by type and group size, booking patterns by day of week and seasonality, response time correlation with win rates, competitive benchmarking against similar venues, and channel attribution showing which marketing drives actual revenue.
Google Analytics shows website traffic. Analytics Suite shows industry benchmarks, competitive positioning, and revenue intelligence from corporate enquiries. It's the difference between knowing "50 people visited your site" and knowing "your competitors are winning deals at £8,200 average spend whilst you're quoting £6,500, and venues responding within 2 hours convert 40% more enquiries."
No. Your specific data is private. What you see are anonymised, aggregated benchmarks across thousands of venues. Competitors can't see your numbers and you can't see theirs—but everyone can see market averages (average spend, conversion rates, seasonal patterns), which helps the entire industry price and operate more intelligently.
Yes. Export any view as PDF or CSV for presentations. Most venues pull quarterly reports showing year-on-year growth, competitive positioning, and ROI attribution. The data is presentation-ready and shows whether you're priced above or below market averages for comparable events.
Response time. Almost every venue thinks they respond "fast enough", then they see data showing venues responding within 2 hours convert 40% more enquiries than slower competitors. That one insight alone often drives immediate process changes that pay for the platform within weeks by converting more of the same enquiry volume.
.png)
.png)